
JP

XR presentation slide improvement example

By improving Complexity and attention, the slide diagnosis result went from 37 points to 89 points!
Create a presentation that conveys the points you want to convey to your audience!

Customer challenges
good presen!, which supports more than 100 business presentations a year, and ALPHABOAT, which supports corporate communication measures, are jointly releasing "XR Presen!", which increases the effectiveness of presentations on "ALPHABOAT XR STUDIO". A request was made to objectively show the client whether such slides are easy to view. We needed to have a concrete understanding of the key points of the slides that would be easy to understand even when viewed online.
Results obtained
Utilizing Explainable KANSEI 's "complexity analysis" and "attention analysis", we analyzed the sample before slides and created the after after understanding the problems. In the good presen! slide diagnosis, there was a change in score from 37 points to 89 points, and the difference is obvious in the video comparing the before and after. We have completed a sample that is easy for the client to understand. Click here for sample video
Background of introduction
While anyone can easily create presentation slides using tools such as PowerPoint, it was only possible to judge subjectively whether the slides were ``easy to convey'' or not. Explainable KANSEI was introduced to define the optimal amount of coverage and high attention-grabbing design for "XR Presen!".
Improvement flow
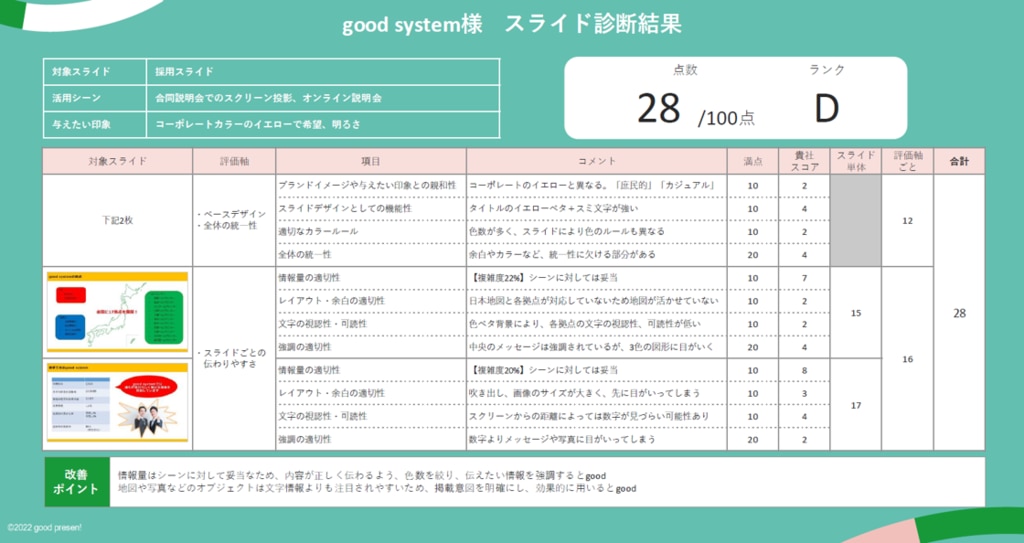
1. Diagnosis evaluation axis setting
In order to objectively evaluate slides, we set evaluation axes for slide design elements. The evaluation axis sets the important elements in presentation slides (e.g. layout, amount of information, etc.) and quantitatively measures them using Explainable KANSEI to score the ease of communication of each slide design. To do.
2. Analyzing existing slides
As a first step, we analyzed the existing slides.
When the existing slide (Before) was subjected to "complexity analysis", the complexity was 23.24%.
The result is a high level of complexity for a presentation that is easy to understand.
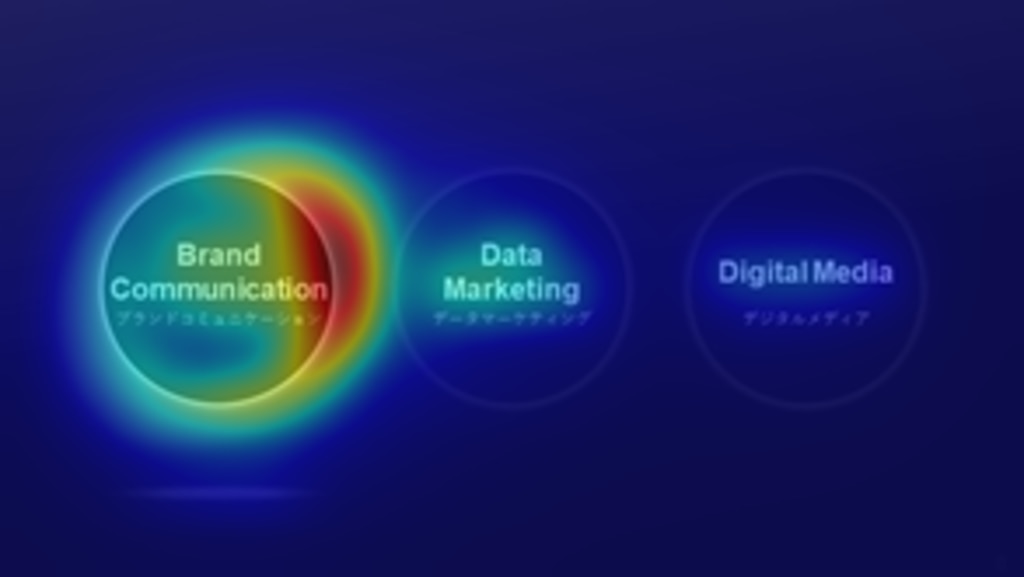
In addition, in the ``attention analysis'', we found that ① company information (corporate logo) and ② names of each business are more prominent than ③ purpose, which we want to emphasize.
Complexity analysis

Attention analysis

3. Split and improve slides
Aiming for slides that can be seen and understood rather than read and understood, the slides are divided into three sections: 1) company, 2) business, and 3) purpose.
For example, the complexity of ② business-only slides decreased from 23.24% to 8.85%.
In addition, by adding color to only the "brand communication" that you want to convey most in your business, you will attract more attention. By changing the design to white text on a black background, the business name itself is now clearly visible.
Complexity analysis

Attention analysis
4. Confirm results
By improving the complexity and attention of the slides and changing the design to match the virtual space, the slide diagnosis score increased from 37 points to 89 points. We were able to produce samples that satisfied the client.
Improvement cases have been covered by the media,
It has been very well received.
Click here to check the article
Improved Complexity and attention improve slide diagnostic results.
37 points ⇒ 89 points!
Create a presentation that conveys the points you want to convey to your audience!
37 points ⇒ 89 points!
Create a presentation that conveys the points you want to convey to your audience!
Consultation regarding the use of “XR Presen!” and slide diagnosis service
CCG TO Co., Ltd. good presen! Division
Contact form: https://goodpresen.jp/contact/
\Now offering a 14-day Free Trial campaign/
Explainable KANSEI has been featured in many major media outlets such as Nihon Keizai Shimbun and NHK.
Would you like to try it for free too?
Would you like to try it for free too?
Other success stories
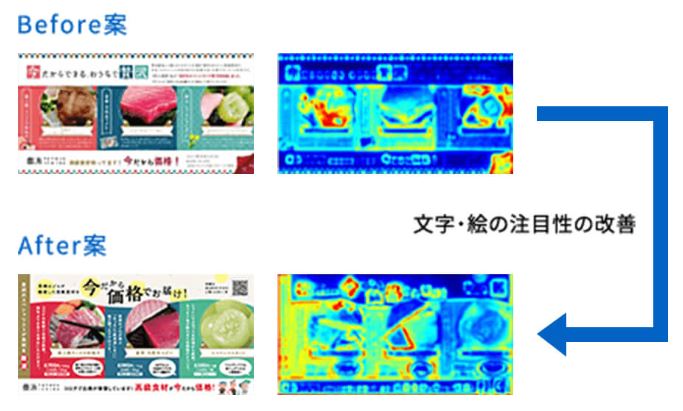
We have achieved great results by improving the design of various materials such as advertisements, menus, web packages, etc.
Please check the results for yourself.
menu design
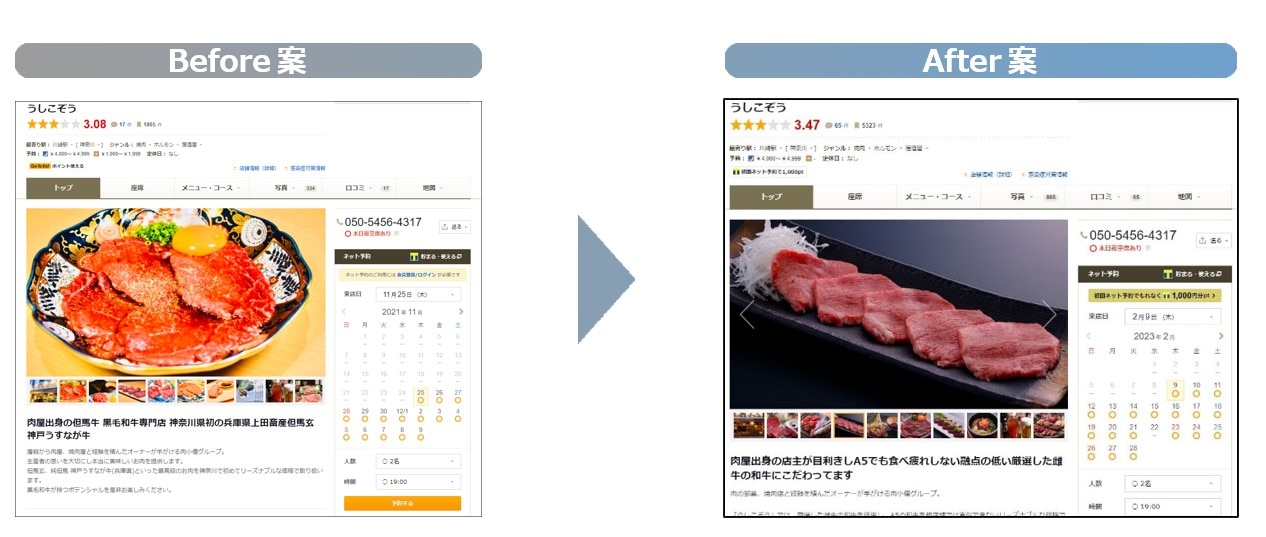
In addition to the color that gives a sense of luxury, we have improved the way to draw attention to the meat, increasing the reservation rate from the web to 172%!
Web design
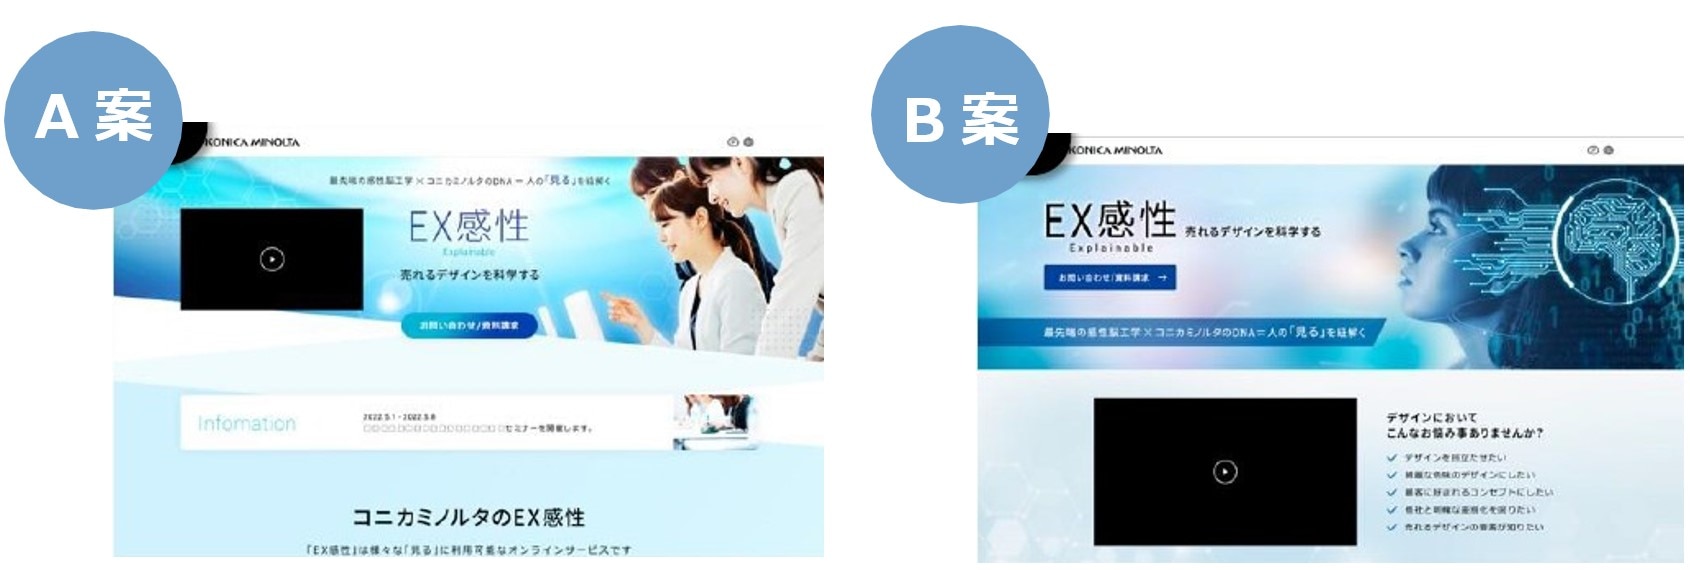
From multiple web design options, you can objectively and quantitatively narrow down the options to those that are close to your appealing image and attract attention!
direct mail
The improved design was ranked number one in a local media newspaper, greatly contributing to increased recognition!
Explainable KANSEI I want to know more about
With service materials, webinars, and demo videos. If you see this, you'll definitely want to use your Explainable KANSEI.
Understand in 3 minutes!
Explainable KANSEI Overview Material

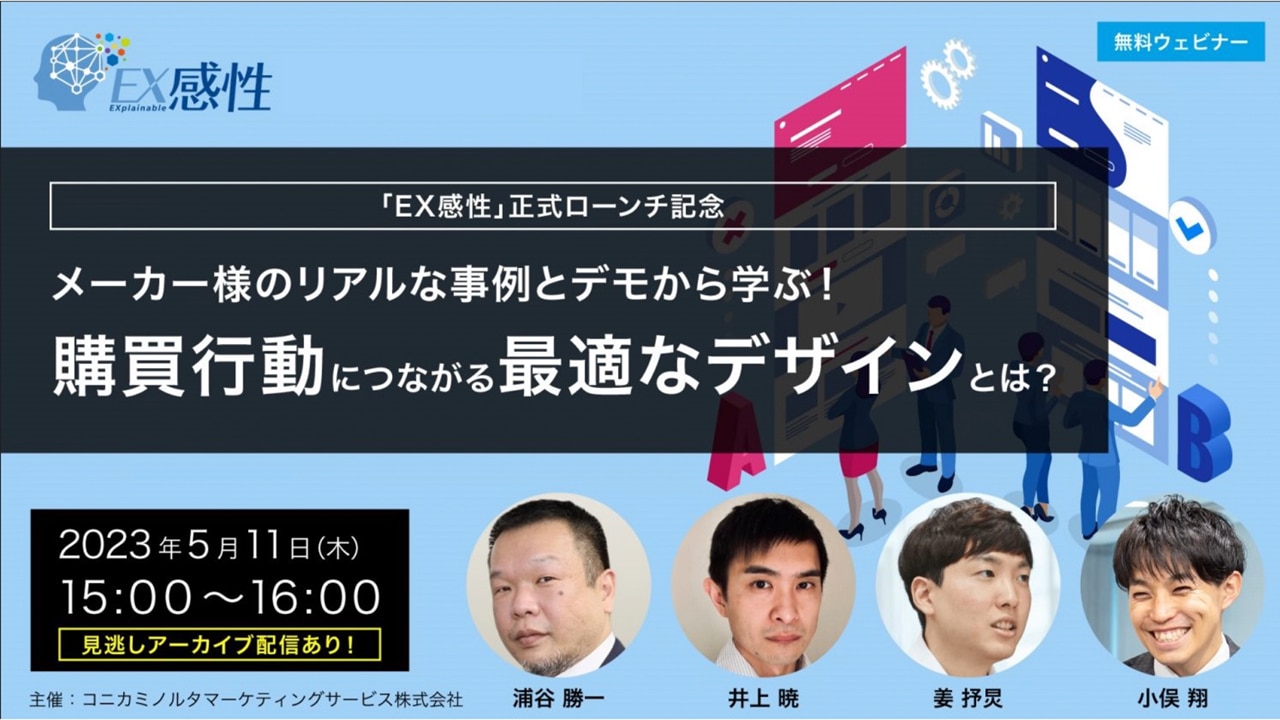
Find out in the video!
Latest popular webinar
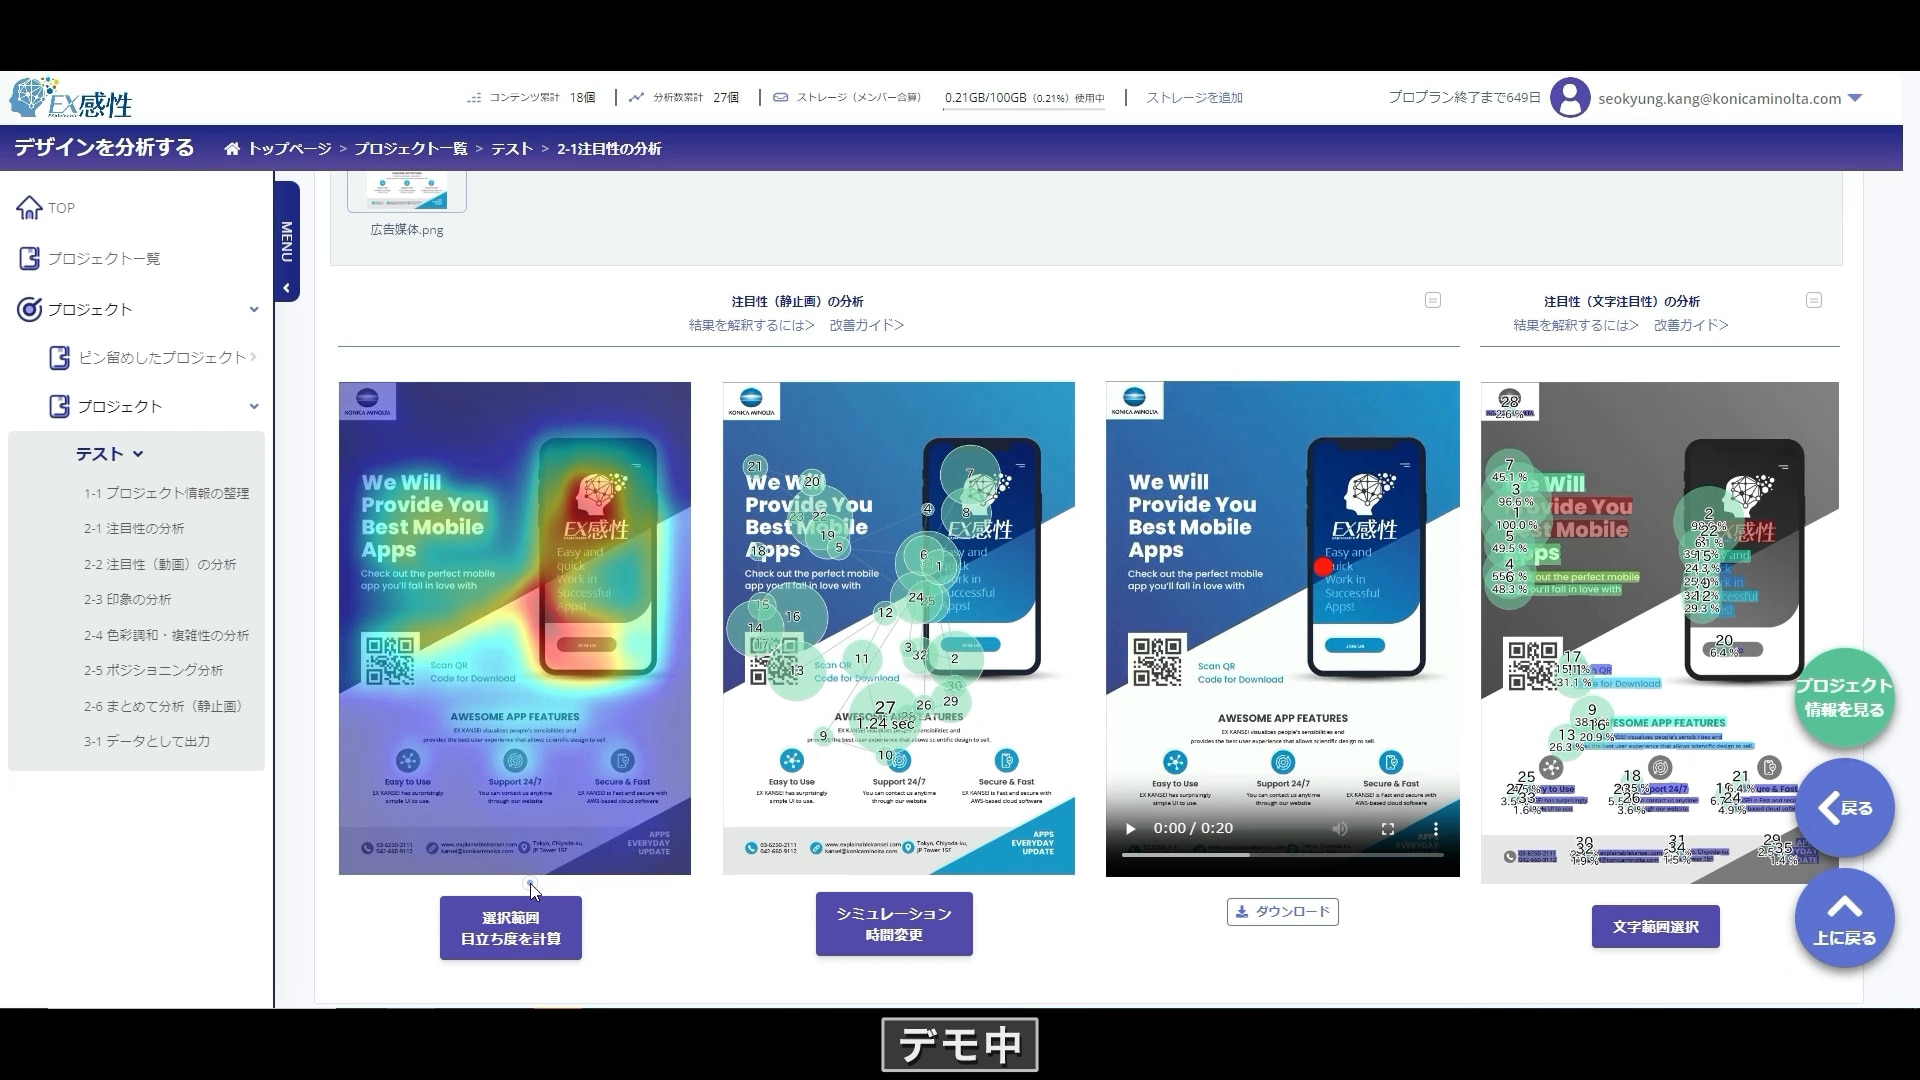
Understand through actual operation!
Explainable KANSEI demo video
\Now offering a 14-day Free Trial campaign/
Explainable KANSEI has been featured in many major media outlets such as Nihon Keizai Shimbun and NHK.
Would you like to try it for free too?
Would you like to try it for free too?


©2021-2023 Konica Minolta, Inc.